

SPECIAL REPORT
Is AI Really an Environmental Threat?

© CURRENT YEAR, AI Business Lab. All rights reserved.
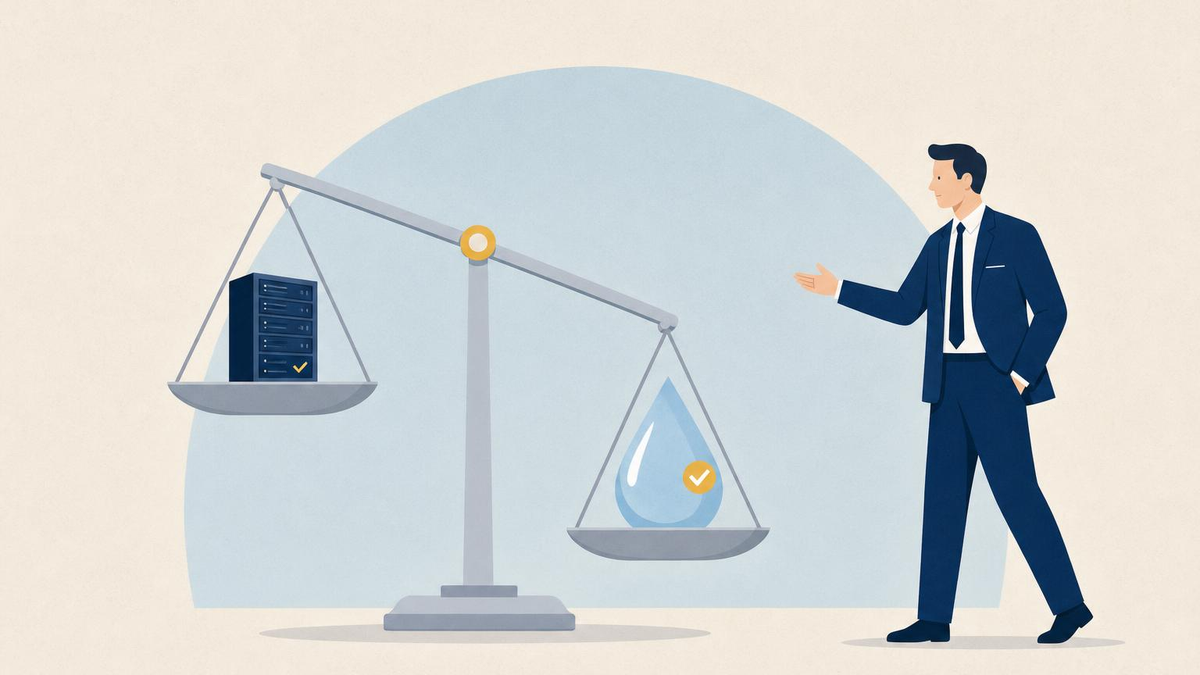
One hamburger patty consumes more water than every AI prompt you’ll ever type—combined.
These three headlines ran within a single week this past June:
“AI’s Secret Water Crisis: How Data Centres Are Draining Freshwater Reserves Across the World.”1
“Majority of U.S.’s New AI Datacenters to Be Built on Drought-Hit Land.”2
“Energy, Water Use and Pollution of AI and Data Centers Rival Most Countries.”3
Add a United Nations report warning that AI threatens “natural resources for billions,”4 and you could be forgiven for concluding that every chatbot conversation is a small act of ecological vandalism.
I want to take that concern seriously. Some of the most thoughtful people I know hold it, including scientists whose job is to study exactly these questions. The concern is sincere, and parts of it are legitimate. I will tell you which parts before we are done.
But the picture those headlines paint is not the picture the data paints, and the gap between the two is wide enough to deserve its own examination. So this paper asks three questions of the AI-environment story, the same three questions I would ask of any alarming claim:
- Who profits from my fear?
- Compared to what?
- What does this projection assume will never change?
By the end, I think you will see why I am not panicked. You will also see why “not panicked” is different from “not paying attention.”
The Business Model Behind the Headlines
Fear sells, and the people selling it know that. We can measure it.
In 2023, researchers published a study in Nature Human Behaviour analyzing roughly 105,000 headline variations that generated 5.7 million clicks across more than 370 million impressions. For a headline of average length, each additional negative word increased the click-through rate by 2.3 percent. Positive words decreased clicks.5
Now put yourself in the chair of an editor deciding between “Data Centers Use 0.2 Percent of U.S. Water” and “AI’s Secret Water Crisis Is Draining the World’s Freshwater.” Both can be defended from the same underlying report. Only one pays the bills.
I spent decades in publishing. I have sat in the meetings where headlines get chosen. Nobody in those rooms is lying, exactly. They are selecting and amplifying, with an algorithm grading their work in real time, and the result is a news diet tilted toward alarm on every topic, not just this one.
The headlines can be true and still tell you nothing about proportion. For proportion, you need the second question.
The Most Useful Question in Statistics
When someone tells you a number is big, ask: compared to what?
Take water, the claim that generates the most visceral reactions. The most rigorous public estimate we have comes from Lawrence Berkeley National Laboratory, in a report commissioned by the U.S. Department of Energy. It found that all U.S. data centers combined consumed about 17.4 billion gallons of water directly in 2023.6
Seventeen billion gallons sounds enormous. It is roughly the usage of 160,000 American households.
One caveat before the comparison. AI moves faster than water accounting, so 2023 is the most recent year with a rigorous federal measurement. That is why the table below also includes Berkeley Lab’s projection for 2028, which assumes the AI buildout continues at full speed. Now place those figures next to the other ways America uses water:
| Annual U.S. Water Use | Estimated Gallons per Year |
|---|---|
| Municipal/public water supply7 | ~14.2 trillion |
| Irrigation for livestock feed and forage (estimate)8 | ~9 trillion |
| Residential landscape irrigation9 | ~3.3 trillion |
| California almond production10 | ~1.3–1.6 trillion |
| All U.S. golf courses11 | ~531 billion |
| All U.S. data centers, projected for 2028 (direct)12 | ~38–73 billion |
| All U.S. data centers, 2023 (direct)13 | ~17.4 billion |
Municipal water systems move roughly 800 times more water than every data center in the country combined. Lawns use about 190 times more. California’s almond orchards, by themselves, use 75 to 90 times more. Golf courses use about 30 times more. Against total U.S. water withdrawals of about 322 billion gallons per day,14 the data center industry’s entire annual direct consumption amounts to roughly 80 minutes of national water use.
The projection row answers the obvious objection that the baseline is growing. Run the test against 2028 instead. Even at the top of Berkeley Lab’s band, 73 billion gallons, golf courses would still use seven times more water than every data center in America, almond orchards roughly twenty times more, and municipal systems about 200 times more. Quadrupling the number does not change the conclusion.
A fair-minded critic will raise two objections here, and both deserve answers.
First: what about the water used to generate the electricity data centers consume? The same Berkeley Lab report estimates that indirect footprint at about 211 billion gallons in 2023.15 Add it to the direct figure and you get roughly 228 billion gallons, which moves data centers from “a rounding error” to “about an eighth of what almond orchards and golf courses use together.” The ranking holds. Note, too, that the indirect figure is really a critique of how America generates electricity, since every consumer of grid power, from hospitals to hair dryers, carries a proportional share of it.
Second: aren’t you mixing different kinds of water accounting? Partly, yes. Hydrologists distinguish withdrawals (water taken from a source, much of it returned) from consumption (water evaporated or otherwise removed). The municipal figure is withdrawals; the data center figure is consumption; the agricultural figures are applied irrigation water. These are not perfectly commensurable. But the gap between data centers and the other categories spans two to three orders of magnitude, and no accounting convention closes a gap that size.
The same proportion test works at the level of your own usage. Google now publishes audited per-prompt figures: the median text prompt to its Gemini models consumes 0.26 milliliters of water, about five drops.16
A single ten-minute shower with a standard 2.5-gallon-per-minute showerhead uses 25 gallons, the water equivalent of more than 300,000 of those prompts. One hamburger patty, whose beef carries a water footprint of roughly 15,400 liters per kilogram,17 represents more AI prompts than you could type in a lifetime. (Most of beef’s footprint is rainwater on pasture and feed crops rather than municipal supply, so the comparison is directional, but the magnitudes are not close.)
What About Electricity and Carbon?
Water is the most emotionally charged claim. Electricity is the more substantial one, so let us give it the same treatment.
The numbers, again from the primary sources rather than the headlines: U.S. data centers consumed about 176 terawatt-hours in 2023 and an estimated 183 terawatt-hours in 2024, roughly 4.4 percent of national electricity, with 2025 estimates running north of 200. Berkeley Lab projects the share could reach 6.7 to 12 percent by 2028.18
Globally, the International Energy Agency puts data centers at about 415 terawatt-hours in 2024, around 1.5 percent of world electricity, roughly doubling to about 3 percent by 2030.19
That is real growth, and I am not going to wave it away. But apply the proportion test once more. The IEA calculates that the entire global increase in data center demand through 2030 represents about 8 percent of total electricity demand growth. Air conditioning will add more (651 terawatt-hours). Electric vehicles will add more still (838 terawatt-hours).20
Nobody is writing headlines about the air conditioning apocalypse, even though it will outgrow AI this decade. That asymmetry tells you something about question one.
Carbon follows the same pattern. Data centers account for roughly 0.5 to 1.2 percent of global CO₂ emissions today, depending on what you count; the IEA’s central scenario has them reaching about 1 percent by 2030. Aviation, for reference, sits around 2 percent.21 If a 1 percent emitter constitutes a planetary emergency, we have several larger emergencies that should be in line ahead of it.
And the per-use numbers have collapsed even as the totals grew. For years, the standard claim was that a chatbot query consumed about 3 watt-hours, “ten times a Google search.” When the research group Epoch AI re-derived that figure in 2025 using current models and hardware, the realistic answer was about 0.3 watt-hours, one-tenth the canonical claim.22 Google’s own published median is 0.24 watt-hours per prompt, the energy of watching nine seconds of television.23
What the Critics Get Right
Now for the part where I argue against myself, because the case I am making does not require pretending the critics have nothing.
Local water stress is real. National totals can hide local pain. The Guardian analysis behind that second headline found that 517 of 809 planned U.S. data centers sit in areas that experienced drought in the past year.24 A data center is a point load. Seventeen billion gallons spread across the country is trivial, but a single large facility in a small, dry watershed can be a serious problem for its neighbors.
Communities in those places should ask hard questions about siting and water sourcing, and companies should answer them publicly. A local water problem is a real problem. “This facility is straining our watershed” and “AI is draining the world’s freshwater” are different claims, and the difference matters.
Grid strain in specific regions is real. Northern Virginia, parts of Georgia, and central Texas are absorbing concentrated demand growth faster than transmission and generation can comfortably expand. That creates legitimate fights over rates, reliability, and who pays for new infrastructure.
Transparency is too thin. Most operators still do not disclose facility-level water and energy data. Google publishing audited per-prompt figures is progress; an industry-wide norm would be better. Skeptics earned this point, and the pressure they apply is productive.
The growth projections could prove right. The Berkeley Lab and IEA numbers come with a wide band of uncertainty, and the top of the band is large. Which brings us to the third question, because whether we land at the top or the bottom of that band depends on the one variable the scary projections hold constant.
The Variable Every Projection Misses
Every alarming forecast shares a hidden assumption: that the technology of tomorrow will work like the technology of today, only bigger. History keeps embarrassing that assumption.
In 1999, Forbes published an article by Peter Huber and Mark Mills called “Dig More Coal, the PCs Are Coming.” It claimed the digital economy was already consuming about 13 percent of U.S. electricity and projected that half the grid would power it within a decade.25 Policymakers cited it. Utilities planned around it.
Then Jonathan Koomey’s team at Berkeley Lab checked the arithmetic and found the estimates inflated by as much as a factor of eight.26 When the deadline arrived, internet-related computing used a low single-digit share of U.S. electricity. The prediction missed by an order of magnitude, in an alarming direction.
It happened again a decade later. Through the 2010s, forecasts insisted data center energy use would double or triple as cloud computing exploded. Instead, a 2020 study in Science found that while data center computing output grew about 550 percent between 2010 and 2018, energy consumption grew just 6 percent.27 Computing got radically more efficient faster than demand grew. The trend line everyone extrapolated broke.
It is breaking again, in real time. Over one recent twelve-month period, Google reduced the energy of a median Gemini prompt by a factor of 33 and its carbon footprint by a factor of 44, while the responses got better.28
Microsoft announced in 2024 that all new data centers will use closed-loop cooling that consumes zero water for evaporation, saving more than 125 million liters per facility per year, with pilot sites already running in Phoenix and Wisconsin.29 Tech companies are funding the restart of shuttered nuclear plants, including Three Mile Island’s Unit 1, to add carbon-free supply.30 None of these innovations existed in the baseline of the projections that produced the headlines.
I find it almost poetic that the golf courses in our comparison table prove the same point. U.S. golf cut its water use 31 percent since 2005 through moisture sensors, drought-tolerant turf, and smarter irrigation.31 Industries respond to scarcity and scrutiny, and they always have.
The price signal and the public-pressure signal both work, and data centers face stronger versions of both than golf ever did, because water and power are among their largest operating costs. A data center operator wastes water and energy at the expense of its own margins.
There is one objection I want to answer directly. Economists call it the Jevons paradox: efficiency makes a resource cheaper to use, which can increase total consumption.32 It is a real effect, and AI may exhibit it; cheaper queries mean more queries.
But look at what the paradox concedes. Efficiency gains are coming, demand responds to them, and therefore static projections are unreliable in both directions. Jevons cannot rescue the scary trend line; it replaces one uncertainty with another.
The better question is what we get for what AI consumes. A technology that helps optimize power grids and accelerate materials science, applications the IEA itself highlights,33 is a very different thing from leaving the lights on in an empty room.
How to Read the Next Scary Headline
The headlines will keep coming, so here is the framework in portable form.
Ask who profits from your fear. Treat this as a filter, not a conspiracy theory. An attention economy rewards alarm with clicks, and that incentive shapes coverage before any individual journalist makes a single choice. Read past the headline to the underlying number.
Ask “compared to what?” A statistic without a denominator is a mood dressed up as a fact. Seventeen billion gallons is terrifying in isolation and unremarkable next to lawns, almonds, or golf. Same number, two different realities.
Ask what the projection assumes will never change. Every “by 2030, AI will consume X” forecast extrapolates today’s technology into tomorrow’s world. The 1999 internet panic, the 2010s data center panic, and the 33-fold efficiency gain of the past year all teach the same lesson: in technology, the curve bends, because thousands of engineers are paid specifically to bend it.
None of this licenses complacency. Hold companies accountable for local water impacts. Demand disclosure. Watch the regional grids. Those are the real issues hiding under the apocalyptic framing, and they are ordinary infrastructure-policy issues of the kind we have managed before.
But the next time a headline tells you a number is big, ask the question the headline is hoping you won’t.
Compared to what?
Notes
- “AI’s Secret Water Crisis: How Data Centres Are Draining Freshwater Reserves Across the World,” Times of India , June 8, 2026. ↩︎
- Nina Lakhani, “Majority of U.S.’s New AI Datacenters to Be Built on Drought-Hit Land,” The Guardian , June 8, 2026. The analysis found 517 of 809 planned data centers located in areas that experienced drought conditions during the prior year. ↩︎
- Seth Borenstein, “Energy, Water Use and Pollution of AI and Data Centers Rival Most Countries,” Associated Press, June 3, 2026. ↩︎
- “AI’s Environmental Costs Threaten Water, Land and Climate,” UN News, June 2026, https://news.un.org/en/story/2026/06/1167658 , reporting on the United Nations University Institute for Water, Environment and Health study. ↩︎
- Claire E. Robertson et al., “Negativity Drives Online News Consumption,” Nature Human Behaviour 7 (2023), https://www.nature.com/articles/s41562–023–01538–4. ↩︎
- Arman Shehabi et al., 2024 United States Data Center Energy Usage Report (Berkeley, CA: Lawrence Berkeley National Laboratory, December 2024), https://eta-publications.lbl.gov/sites/default/files/2024-12/lbnl-2024-united-states-data-center-energy-usage-report_1.pdf. Direct water consumption of 17.4 billion gallons in 2023, projected to reach 38–73 billion gallons by 2028; indirect (electricity-related) water footprint of approximately 211 billion gallons in 2023. The Electric Power Research Institute (EPRI) has published a similar ~17-billion-gallon estimate for 2023. ↩︎
- U.S. Geological Survey, Estimated Use of Water in the United States in 2015 , Circular 1441 (2018), https://pubs.usgs.gov/publication/cir1441. Public-supply withdrawals of 39.0 billion gallons per day (~14.2 trillion gallons per year); total U.S. withdrawals of approximately 322 billion gallons per day. ↩︎
- Estimate derived from Mesfin M. Mekonnen and Arjen Y. Hoekstra, “A Global Assessment of the Water Footprint of Farm Animal Products,” Ecosystems 15 (2012): 401–415, combined with USGS irrigation withdrawal data. Feed production accounts for approximately 98 percent of the water footprint of animal products. This figure is an estimate of irrigation water applied to U.S. feed and forage crops and carries wider uncertainty than the directly measured categories in the table. ↩︎
- U.S. Environmental Protection Agency, WaterSense Program, “Outdoors,” https://www.epa.gov/watersense/outdoors. Landscape irrigation is estimated at nearly 9 billion gallons per day (~3.3 trillion gallons per year), with as much as 50 percent lost to evaporation, wind, or runoff. ↩︎
- California Water Impact Network, “California Almond Water Usage: Updated,” September 2024, https://www.c-win.org/cwin-water-blog/2024/9/23/california-almond-water-usage-updated. Almond orchards consume an estimated 4.7–5.5 million acre-feet per year (roughly 1.3–1.6 trillion gallons), or about 1.1 gallons per almond kernel. ↩︎
- Golf Course Superintendents Association of America, Golf Course Environmental Profile, Water Use and Management Practices Survey (2025), https://www.gcsaa.org/who-we-are/media/news-release/2025-news-releases/2025/12/30/golf-courses-reduce-water-usage-by-31-percent-according-to-national-survey. U.S. golf facilities applied a projected 1.63 million acre-feet (~531 billion gallons) in 2024, a 31 percent reduction since 2005. ↩︎
- Shehabi et al., 2024 United States Data Center Energy Usage Report. ↩︎
- Shehabi et al., 2024 United States Data Center Energy Usage Report. ↩︎
- U.S. Geological Survey, Estimated Use of Water in the United States in 2015. ↩︎
- Shehabi et al., 2024 United States Data Center Energy Usage Report. ↩︎
- Google Cloud, “Measuring the Environmental Impact of AI Inference,” August 2025, https://cloud.google.com/blog/products/infrastructure/measuring-the-environmental-impact-of-ai-inference/. Median Gemini Apps text prompt: 0.24 watt-hours of energy, 0.26 milliliters of water, 0.03 grams CO₂-equivalent; energy and carbon per prompt fell 33x and 44x respectively over the preceding twelve months. ↩︎
- Mekonnen and Hoekstra, “A Global Assessment of the Water Footprint of Farm Animal Products”: beef carries a global-average water footprint of 15,400 cubic meters per ton, the majority of it “green” (rain) water embedded in feed and forage. ↩︎
- Shehabi et al., 2024 United States Data Center Energy Usage Report : 176 TWh and 4.4 percent of U.S. electricity in 2023, projected to 6.7–12 percent (325–580 TWh) by 2028. The 2024 figure (~183 TWh) and 2025 estimate (over 200 TWh) are International Energy Agency data as reported in Pew Research Center, “What We Know About Energy Use at U.S. Data Centers amid the AI Boom,” October 24, 2025, https://www.pewresearch.org/short-reads/2025/10/24/what-we-know-about-energy-use-at-us-data-centers-amid-the-ai-boom/. ↩︎
- International Energy Agency, Energy and AI , World Energy Outlook Special Report (April 2025), https://www.iea.org/reports/energy-and-ai. Data centers consumed ~415 TWh (~1.5 percent of global electricity) in 2024, projected to ~945 TWh (~3 percent) by 2030; that growth equals ~8 percent of total demand growth, less than air conditioning (651 TWh) or electric vehicles (838 TWh). ↩︎
- International Energy Agency, Energy and AI. ↩︎
- Carbon Brief, “AI: Five Charts That Put Data-Centre Energy Use—and Emissions—into Context,” https://www.carbonbrief.org/ai-five-charts-that-put-data-centre-energy-use-and-emissions-into-context/ , drawing on IEA data: data centers ≈0.5 percent of global CO₂ emissions today, ≈1 percent by 2030 in the central scenario; aviation ≈2 percent. ↩︎
- Epoch AI, “How Much Energy Does ChatGPT Use?” February 2025, https://epoch.ai/gradient-updates/how-much-energy-does-chatgpt-use. A typical GPT-4o query consumes roughly 0.3 watt-hours, about one-tenth of the widely cited 3-watt-hour figure. ↩︎
- Google Cloud, “Measuring the Environmental Impact of AI Inference.” ↩︎
- Lakhani, “Majority of U.S.’s New AI Datacenters to Be Built on Drought-Hit Land.” ↩︎
- Peter Huber and Mark Mills, “Dig More Coal, the PCs Are Coming,” Forbes , May 1999; Jonathan Koomey et al., Rebuttal to Testimony on “Kyoto and the Internet: The Energy Implications of the Digital Economy,” LBNL-46509 (Berkeley, CA: Lawrence Berkeley National Laboratory, 2000), https://eta-publications.lbl.gov/sites/default/files/lbnl-46509.pdf. ↩︎
- Koomey et al., Rebuttal to Testimony on “Kyoto and the Internet: The Energy Implications of the Digital Economy.” ↩︎
- Eric Masanet, Arman Shehabi, Nuoa Lei, Sarah Smith, and Jonathan Koomey, “Recalibrating Global Data Center Energy-Use Estimates,” Science 367, no. 6481 (2020): 984–986, https://www.science.org/doi/10.1126/science.aba3758. Global data center compute instances grew ~550 percent from 2010 to 2018 while energy use grew ~6 percent. ↩︎
- Google Cloud, “Measuring the Environmental Impact of AI Inference.” ↩︎
- Data Center Dynamics, “Microsoft’s Upcoming Data Centers to Use Closed Loop, Zero-Water Evaporation Design,” December 2024, https://www.datacenterdynamics.com/en/news/microsofts-upcoming-data-centers-to-use-closed-loop-zero-water-evaporation-design/. All Microsoft data centers designed from August 2024 onward eliminate evaporative water use, saving more than 125 million liters per facility annually. ↩︎
- Constellation Energy and Microsoft announced a 20-year power purchase agreement in September 2024 to restart Three Mile Island Unit 1 (renamed the Crane Clean Energy Center), adding 835 MW of carbon-free generation. ↩︎
- Golf Course Superintendents Association of America, Golf Course Environmental Profile, Water Use and Management Practices Survey. ↩︎
- For a balanced treatment of the rebound-effect debate as applied to AI, see “From Efficiency Gains to Rebound Effects: The Problem of Jevons’ Paradox in AI’s Polarized Environmental Debate,” Proceedings of the 2025 ACM Conference on Fairness, Accountability, and Transparency , https://arxiv.org/abs/2501.16548. ↩︎
- International Energy Agency, Energy and AI. ↩︎